 If you have a viral coefficient of less than 1, you’re screwed—so the conventional wisdom goes. Your viral coefficient is the rate at which customers refer new customers. With viral coefficient k<1, each new set of customers invites fewer new customers. That continues until your growth totally flattens and your company goes completely stagnant.
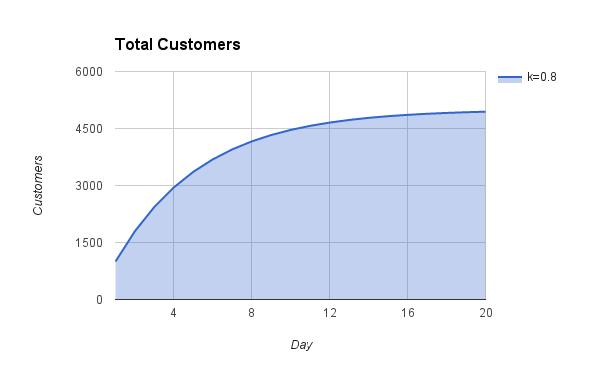
For instance, with k=0.8, your initial set of 1,000 new customers invites 800, who in turn invites 640 customers. By day 20, only 14 new customers join. Over time, the number of new customers who sign up goes to 0.
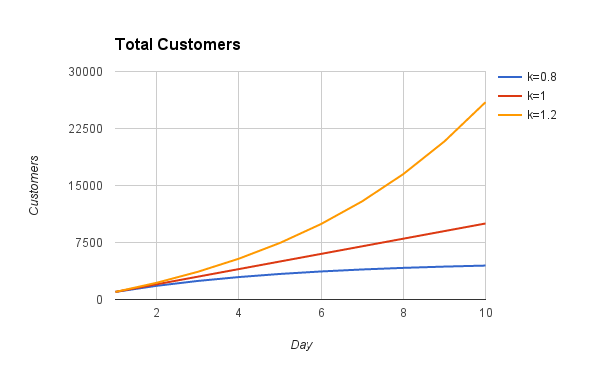
While k<1 flattens, k=1 grows linearly, adding the same number of new customers on each day. k>1 on the other hand, grows exponentially. With only a k=1.2, you see a massive separation of 20,000 customers from k=0.8 *after only 10 days*. That’s why, to many, pushing your referral program’s viral coefficient above 1 is simply one of the most important things that you can do to drive growth.
But there’s a catch that few people talk about—almost no companies reach a k>1 for any sustained period of time. According to Rapportive co-founder Rahul Vohra, “true viral growth is incredibly rare” and you shouldn’t bet your company on it.
That’s the bad news.
The good news is that even a less sexy, non-viral referral program with a k value far less than 1 will do wonders for your business. A solid Refer-a-Friend program will lift all of your non-viral customer acquisition channels and provide the foundation for sustainable, long-term growth from word of mouth. Here’s how.
How to Calculate K
To calculate your viral coefficient k, multiply the average number of referral invitations sent, i, by the conversion rate from invite to sign up, c.
k = i * c
When you multiply k by your number of customers, you get the number of new customers that your previous generation will refer. For example, suppose i=2 invitations sent per customer and c=40% of invitations turn into sign ups. That means if you have 1,000 customers, they’ll send 2,000 invitations and 40% of those will turn into signups. Multiply that out, and you get 800 new customers for day 2.
1,000 * 2 * 0.4 = 800
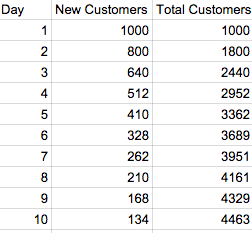
Or in other words, you have k=0.8, which is the factor by which customers spawn new customers via referral. For day 3, 800 * k = 640 giving you 640 new customers for day 3, and so on.
Referral Funnel Metrics
If this math sounds familiar, it’s because what k calculates looks a whole lot like the referral funnel. It’s the rate at which customers go in at the top of the funnel and referred customers emerge from the bottom of the funnel.
At Extole, we refer to this as Referral Index™ (RI), and it’s one of the first things we look at when optimizing referral programs. Stripped of noise, your RI basically tells you how many conversions you get for every advocate—it tracks the efficiency of your entire funnel. If 100 advocates lead to 16 conversions, for example, your RI would rest at 16.
The referral funnel consists of two funnels: (1) the advocate funnel and (2) the friend funnel.
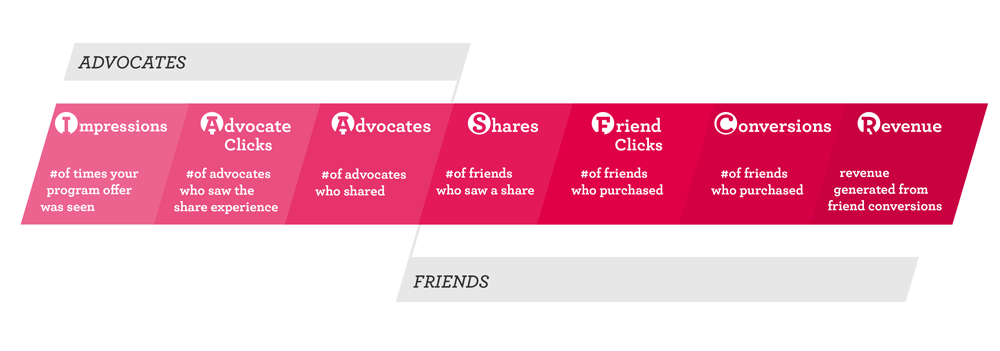
The advocate funnel describes how many of your customers become advocates and how many shares those advocates make. In other words, the advocate funnel is described by i, which is the number of referral invites.
The friend funnel describes how many invited friends become customers themselves. That’s the conversion rate c used in our calculation above, which also corresponds roughly with RI.
We studied the referral programs of 400 customers, and here are the benchmarks we saw:
- 19% of potential advocates become advocates
- 28 Referral Index™
- 2 shares per advocate on average
- Median 1 friend click per share
- 13% conversion rate from click to customer
Using those numbers, we have a i = .19 * 2 = .38 and we have c = 1 * .13 = .13. That gives us k = 0.0494. It’s daunting, because even rounded up to 0.05, our k is still considerably less than the k > 1 standard we set above for virality.
However, it turns out that there’s a growth model for which k < 1 gives us great growth—we just need to dig in more on how companies actually acquire customers.
The Growth Model for K < 1
While it’s true that for k < 1 our purely viral acquisition channel will decay and die off, 99.99% of businesses don’t bet their entire company on that acquisition channel alone. To account for that, we need to modify our model to include other non-referral channels.
Let’s assume that 1,000 new customers join per day from search and 500 new customers join per day from paid acquisition channels like Facebook advertising.
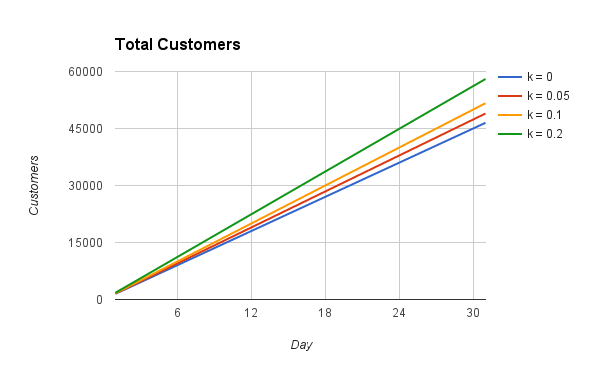
Even with k=0.05, after only 1 month, you have nearly 2,500 more customers than you would without any referral (k=0). By iterating and improving on your referral program, if you’re able to push your k up to 0.2, you’ll see a massive bump for your business. After 1 month, you’ll be pulling in over 10,000 more customers.
That’s because your referral program lifts customer acquisition across all of your channels. For example, with k=0.05, instead of adding 1,000 new customers per day from search, you’ll add 1,053 per day. Instead of adding 500 new customers per day from paid acquisition channels, you’ll add 526.
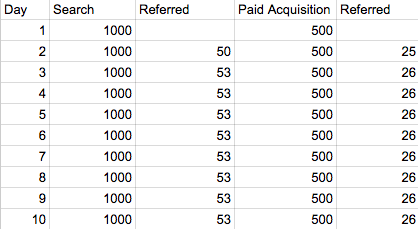
Take search for instance. On day 2, the number of referred customers is the number of customers who came in from search multiplied by k, which gives 1,000 * 0.05 = 50.
On day 3, we do the same calculation, but we also add in day 2 referrals who referred folks for day 3: 1,000 * 0.05 + 50 * 0.05 = 53. On day 4, the number of referred customers will be 1,000 * 0.05 + 53 * 0.05 = 53, and so on. You see the rate of referred customers flatten, but still provide a solid and lasting bump in each channel.
You can generalize this calculation. For any day d, the number of referred customers equals
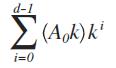
where A_0 is the constant number of new customers you’re bringing in from your other acquisition channels, like search.
That looks complicated, but this type of equation has a name—it’s a geometric series—and there’s a super simple formula to solve it. For k < 1, that formula equals

That number calculates how many new customers you’ll get every month from referral. Going back to our previous example, where A_0=1,000 for the 1,000 people we’re bringing in via search every month, and k=0.05, this formula gives us 1,000 * 0.05 * 1/(1-0.05) = 53.
This is how we derive what Rahul Vohra calls “the amplification factor”

Every set of new customers gets amplified by 1/(1-k)—which is always greater than 1 because k is less than 1—growing the number of customers that get referred by that multiple. Even where we haven’t hit true virality with k > 1, having a referral program will multiply acquisition from all of our channels by the amplification factor, which creates a huge boon for growth.
Amplification Factor Sensitivity and Driving Up Referral Growth
What’s awesome about the relationship between the amplification factor and the viral coefficient is that, in Vohra’s words, “as we increase our viral factor, we increase our amplification factor hyperbolically.”
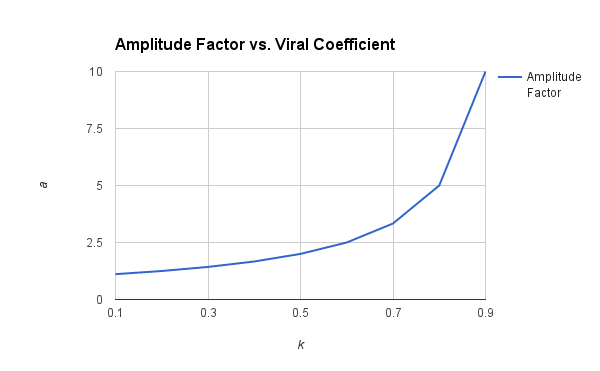
Small changes to k can result in large improvements to our amplification factor, which will drive up acquisition across all of our channels.
To improve k, you need to increase either i, the number of invitations sent, or c, the conversion rate from invite to customer. Suppose that you keep c fixed and graph the relationship between i and a.
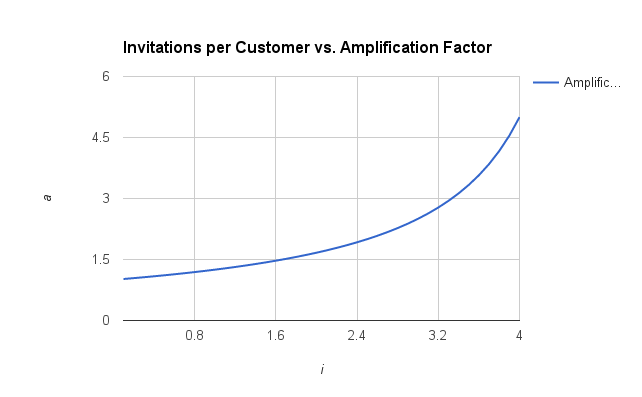
The relationship between i and a mirrors the invitation between k and a—an incremental increase, for example, from 3 invitations per customer to 4 doubles the amplification factor. The same is true for c, your conversion rate from invite to becoming a customer.
This shows how much leverage you can get out of your referral program. Tweak and improve your referral funnel, and you’ll dramatically increase your amplification factor which multiplies the value of all of your acquisition channels.
The Power of Non-Viral Referral
The amplification factor gives us a powerful and inspiring model for non-viral referral growth. That’s why if you have a referral program with k<1, you shouldn’t despair—you’re in a great position.
Dig into each step of the referral funnel.
- Are customers seeing the Refer-a-Friend link?
- Can you reduce friction to make it easier to share across email, contacts, and social media, as broadly as possible?
- How do we help advocates personalize their message?
- How can we welcome friends and make them feel at home?
- How do we make it incredibly easy for them to claim the reward and buy?
Feel confident knowing that even the tiniest of improvements to your referral funnel will rebound through all of your customer acquisition. Bit by bit, each improvement to your referral funnel will make customer acquisition overall cheaper. In time, customer acquisition will become less of a daily grind, and you’ll feel the wind of referral at your back, propelling your growth to greater and greater heights.