Blog
Customer LoyaltyData
How to Measure the Incremental ROI of Loyalty Rewards and Incentives
Courtenay Roche


Products
Enterprise platform
Platform features
Acquisition programs
Retention programs
Learn
Resources
Developers
Documentation
SDKs & GitHub
Partners
Blog
Courtenay Roche
Incrementality is any customer behavior beyond the baseline that a loyalty reward influences, like additional purchases, reviews, or social sharing. The baseline is what customers would have done anyway, with no reward at all. To understand the exact impact of your loyalty rewards, you want to focus on the incremental return on investment (ROI) as well as total program revenue.
Brands can measure the incremental ROI of their loyalty rewards and incentives by comparing customers who get a reward with a randomly held-out control group that doesn't. Calculate the difference in profit as indicated by each group's customer behavior; that difference is your incremental margin. To get incremental ROI, subtract the loyalty program cost from your incremental margin, then divide by that cost. Here's how that looks as an equation:
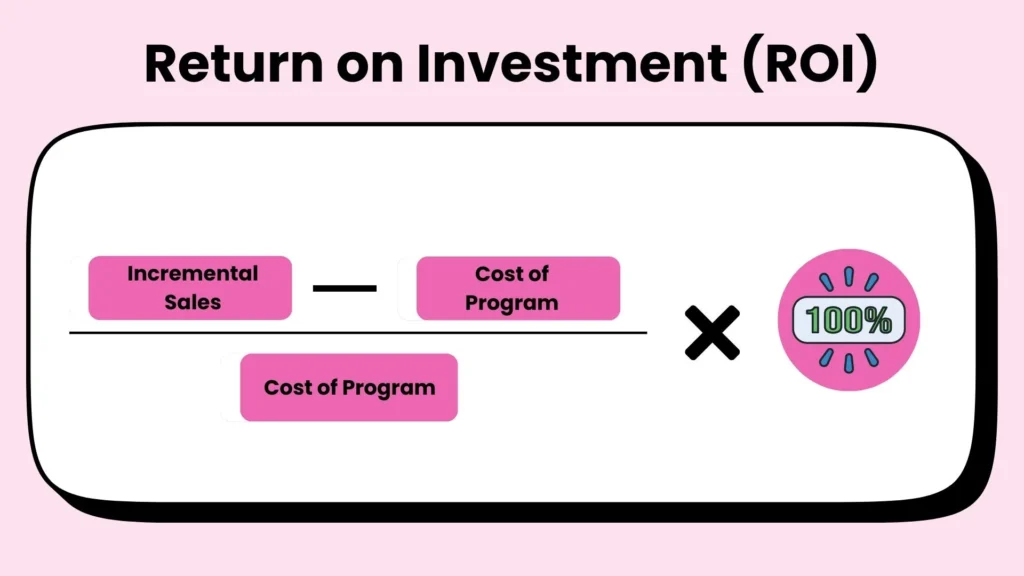
Total program revenue and incremental revenue are different numbers, and each should be considered separately. Total program revenue counts every purchase members make, while incremental revenue counts only the purchases, deposits, or upgrades the program actually caused—it's a way to zoom in on the direct impact of loyalty rewards on your bottom line.
For example: If a credit union member would have opened a savings account without a sign-up bonus, that account shows up in total program revenue but it adds nothing to incremental revenue.
In this article, we use the term "loyalty rewards and incentives" as a blanket term for points, credits, cash, discounts, and rewards for any action. That includes non-purchase actions like writing a review, turning on autopay, or adopting a mobile app. A flexible loyalty program platform lets you reward each of these actions and keep its cost traceable in one place.
The most common loyalty report compares what members spend with what non-members spend. This is not a reliable measure of ROI. The result may look like program impact, but it mostly reflects who chose to join. This problem is called self-selection bias: Your best customers tend to sign up for loyalty rewards because they already make frequent purchases. The group already differs from your baseline customer before any reward is given.
Seminal 2007 research by Leenheer and colleagues, linked here as a working paper, studied Dutch grocery loyalty programs from 1998 to 2000. It shows how self-selection inflates loyalty effects: "The effect size estimate from the naïve model that ignores endogeneity (29.8 percentage points) is on average more than seven times higher than the average estimate for the model that accounts for endogeneity (4.1 percentage point)." In plain terms, the simple comparison credited the programs with far more impact than they caused.
The corrected effect was still positive. The programs did change behavior, and the honest number was simply smaller. Accuracy trumps inflated numbers every time; the goal of measurement is an accurate figure you can defend to finance, and a signal of whether your program is working.
If you're struggling to accurately measure loyalty, you aren't the only one–many teams find this hard. According to the EY loyalty ROI measurement guide, "41% of corporate loyalty leader respondents reported challenges with quantifying overall program impact."
Time-based comparisons carry a similar risk of inaccuracy. Comparing this month with last month can credit the program for seasonality, a price change, or a new product launch. A retailer's holiday sales or a bank's tax-season deposits would rise with or without rewards.
Below, we cover the metrics that actually work to measure loyalty rewards ROI, what they track, and when to use them.
Incremental lift is the difference in behavior between rewarded customers and a comparison group. The table below compares four different methods to estimate lift with different levels of rigor, ranked with the strongest first.
Default to the first method whenever you can. Use the others when randomizing isn't possible.
| Method | Rigor | When to use it | Main limitation |
|---|---|---|---|
| Randomized holdout | Highest | Before launching a new reward or offer | Requires planning before launch |
| Matched control with difference-in-differences | Medium | The program already launched to everyone eligible | Can't adjust for traits missing from your data |
| Staggered rollout | Medium | Launching by region, branch, or store | Locations may differ in ways you can't see |
| Baseline trend projection | Lowest | No comparison group exists at all | Credits outside events to the program |
A randomized holdout is the gold standard for testing. Before launching a loyalty offer, you randomly withhold the reward from a randomly chosen share of an eligible audience that serves as a control group.
Because the groups are sorted randomly, there is low risk of the type of bias you see when measuring loyalty ROI as members vs. non members. Any baseline difference between the two groups is down to chance, so you can attribute any difference in each group's behavior to the reward itself. Researchers call this design a randomized controlled trial.
A 2019 study of ad experiments compared randomized controlled trials versus observational methods: "Generally, the current and more common methods overestimate ad effectiveness relative to what we found in our randomized tests." Rewards face the same risk, so a randomized holdout is the safest default.
What do you do if you can't randomize? What if your whole program already launched before planning a controlled test? Matched control can solve this.
A matched control pairs each member with a similar non-member on key metrics like past spend, visit frequency, tenure, and location. For loyalty programs, propensity matching can be particularly effective. In this type of matching, a statistical model scores how likely each customer was to join, then pairs customers with similar scores. Difference-in-differences (DiD) then compares the before-and-after change for both groups. Suppose members' monthly spend rose $20 and matched non-members' rose $8: the estimated lift is the $12 gap between those changes.
Another way to measure loyalty ROI without a true randomized controlled trial is via staggered rollout. A staggered rollout launches a program in some regions, branches, or stores first, and treats the places still waiting as a natural comparison group, often called a geographic holdout.
A credit union might launch a debit card rewards offer at 10 branches before the rest, or a telecom provider could open a new loyalty perk in two states first and compare plan upgrades.
Baseline trend projection is the weakest option. It extends past results forward and treats any gain above that line as lift. Use it only when no comparison group exists, and treat the result as directional.
A loyalty incrementality test is a planned experiment that checks whether one reward changes one behavior. Testing works best at the offer level. In a configurable platform, each reward can have its own audience, holdout group, and results.
The five steps below work to measure incrementality for a single offer or a full program:
Pick one customer behavior per test. That could be a store visit, a direct deposit, a plan upgrade, or a product review.
Write down the exact metric before launch, such as "first deposit over $500 within 60 days." Locking the definition early keeps the goalposts from moving once results arrive. For help framing the question, see this guide to setting data-driven program goals.
Randomly split one eligible audience into a test group and a holdout group. Both groups must come from the same audience so the comparison stays fair.
You can also test reward types and values at the same time. Extole's built-in A/B testing lets teams test different rewards on a specific subset of customers. A retailer, for example, could compare 500 bonus points and $5 off against a no-reward holdout.
A purchase cycle is the usual time between repeat actions. It might be a few weeks for a retail repurchase, or several months for a bank deposit or telecom plan upgrade.
Contamination happens when holdout customers see or receive the reward anyway. These three safeguards keep the groups separate.
At the end of the test, compare the average behavior of each group. The gap is your lift per customer.
Next, convert lift into dollars: lift per customer × customers in the test group × margin per action. Margin is revenue minus the cost of delivering the product or service. Use margin instead of revenue, because revenue overstates what each action is worth.
Subtract the full cost of the reward from incremental margin, then divide by that cost to get incremental ROI. Next, choose one of three paths.
Re-test every change with the same method. That keeps results comparable from one round to the next.
Here is the loyalty program ROI formula:
Incremental ROI = (incremental margin − total cost) ÷ total cost
A result above zero means the reward earned back more than it cost.
Break-even uplift is the lift you need for incremental ROI to equal zero. Here is its formula:
Break-even uplift = total cost ÷ (customers in the test group × margin per action)
The illustrative example below uses a telecom provider. It offers a $3 bill credit to customers who buy a data or device-protection add-on, and holds out a random control group.
| Item (illustrative) | Value |
|---|---|
| Customers in test group | 20,000 |
| Customers in holdout group | 20,000 |
| Add-ons per customer, test group | 0.40 |
| Add-ons per customer, holdout group | 0.15 |
| Lift per customer (0.40 − 0.15) | 0.25 |
| Incremental add-ons (20,000 × 0.25) | 5,000 |
| Margin per add-on | $10 |
| Incremental margin (5,000 × $10) | $50,000 |
| Reward cost (8,000 add-ons × $3 credit) | $24,000 |
| Platform, fulfillment, and team cost | $6,000 |
| Total cost | $30,000 |
| Incremental ROI (($50,000 − $30,000) ÷ $30,000) | 67% |
Notice that 3,000 of the 8,000 credits went to holdout-rate behavior, meaning purchases customers would have made anyway. That $9,000 is a real cost, and it sits inside the $24,000 reward line.
Break-even uplift here is $30,000 ÷ (20,000 × $10), or 0.15 extra add-ons per customer. Holding total cost at $30,000, a lift of 0.10 would produce $20,000 in incremental margin and an ROI of −33%. A lift of 0.35 would produce $70,000 and an ROI of 133%.
The denominator is the bottom half of the ROI formula: total cost. Undercounting it is the fastest way to overstate ROI.
Accounting rules treat points as a promise to customers. Under IFRS 15, the international revenue standard, unredeemed points are a contract liability based on expected redemption.
An IFRS 15 illustrative example shows an entity issuing 10,000 points. In that IFRS 15 loyalty programme example, "The entity expects 9,500 points to be redeemed." That expectation drives how much revenue is deferred, so your finance team may already estimate it. Use their estimate, then test ROI at higher and lower redemption rates.
Fraud and eligibility rules cut cost that produces no incremental value. For example, limit a bonus to new accounts, cap rewards per household, or pay out only after an account is funded.
Whole-program measurement answers one broad question: is the program worth keeping? Offer-level measurement answers a sharper one: which rewards are worth paying for?
| Factor | Offer or campaign level | Whole-program level |
|---|---|---|
| Question answered | Did this reward change this behavior? | Is the program worth its total cost? |
| Best method | Randomized holdout | Matched control, DiD, or staggered rollout |
| Time to result | One purchase cycle | Several quarters |
| Main use | Tune reward value, audience, and timing | Justify the budget to finance and leadership |
| Example | A $50 bonus for a first direct deposit | A bank's full member rewards program |
Segment-level incrementality measures lift for each customer group separately. The same reward can be incremental for lapsing customers and pure subsidy for top customers who would buy anyway.
A retailer might find that a 20% off reward wins back lapsed shoppers. The same reward may simply discount purchases its best customers had already planned.
This approach works across loyalty, referral, and reward-for-action programs. Test a review reward, an app adoption bonus, and a referral reward the same way, each with its own holdout.
Extole recommends confirming segment-level lift with a dedicated holdout before scaling a targeted reward. A result that holds for one segment may not carry over to another.
Loyalty program metrics work best in three tiers. Each tier answers a different question for a different reader.
| Tier | What it shows | Example metrics | Main reader |
|---|---|---|---|
| Behavior | Whether rewards change actions | Lift vs. holdout, repeat purchase rate, actions per customer | Program team |
| Program health | Whether the program is engaging and sustainable | Active member rate, cost per incremental action, points liability, fraud rate | Program and finance teams |
| Business impact | Whether the program grows the business | Incremental margin, incremental ROI, retention, CLV, share of wallet | Leadership |
Tie reporting cadence to the purchase cycle. A retailer might review behavior metrics weekly, while a bank reviews them monthly. Report business impact quarterly so leadership sees results across full cycles.
Customer lifetime value (CLV) is the total margin a customer brings over the full relationship. A reward that improves retention may pay off over years, so compare CLV for test and holdout groups over time. For ways to grow it, see these customer lifetime value tactics.
A measurement stack is the set of tools that captures, stores, and reports program data. It turns a good test design into numbers finance can trust.
Extole's event system tracks events like shares, clicks, conversions, and rewards. Its real-time reporting and analytics connect that activity to lifetime value in one view.
With Extole audiences and reports, teams can target offers to defined segments and pull results for deeper analysis. Reports can run once or on a set schedule. Teams can download them or receive them via API or SFTP.
Extole also integrates with CRMs, CDPs, marketing automation platforms, and ecommerce platforms, so reward data joins the rest of your customer data.
Make it large enough to detect the smallest lift worth acting on, which an analyst can calculate with a standard power analysis. Smaller expected lifts need larger holdouts, so balance accuracy against the margin you give up by withholding the reward.
Behavior lift can appear within one purchase cycle, but retention and CLV gains build as customers stay. Report early lift quarterly and confirm long-term value once a year.
Last month had its own seasonality, prices, and promotions, so any change may come from those instead of the reward. A holdout group that lives through the same month gives you a fair baseline.
Measure both, because campaign results show which rewards to tune and program results show whether the total budget pays off.
Treat breakage as an estimate that lowers expected cost, not as profit, because redemption behavior can change. Model ROI across a range of redemption rates so the result holds if more customers redeem.
Extole helps teams build, target, and test every reward as its own measurable offer, across loyalty, referral, and reward-for-action programs. If you want to see what you can build with Extole, request a demo.

Learn which software prevents conflicting promotions in ecommerce, how priority and eligibility rules work, and how to choose the right mix for your team.

Compare eight platforms for lifecycle-based customer incentives, including offer management, lifecycle automation, loyalty, and promotion tools, plus selection guidance.

Learn how credit unions can use AI to find likely members, personalize offers, improve onboarding, and strengthen referrals, plus what banks can take from the same playbook.