

NPS asks customers if they’d recommend you. It doesn’t tell you if they actually will—or if they already have. That gap between stated intent and real behavior is why many enterprise teams are moving beyond NPS—a 2025 TELUS Digital and Statista survey found only 23% of enterprise CX leaders still use it as a performance metric. This guide covers 10 NPS alternatives that measure what customers actually do, from repeat purchases and retention to referral activity and lifetime value, along with how to choose the right mix for your business.
What is the Net Promoter Score
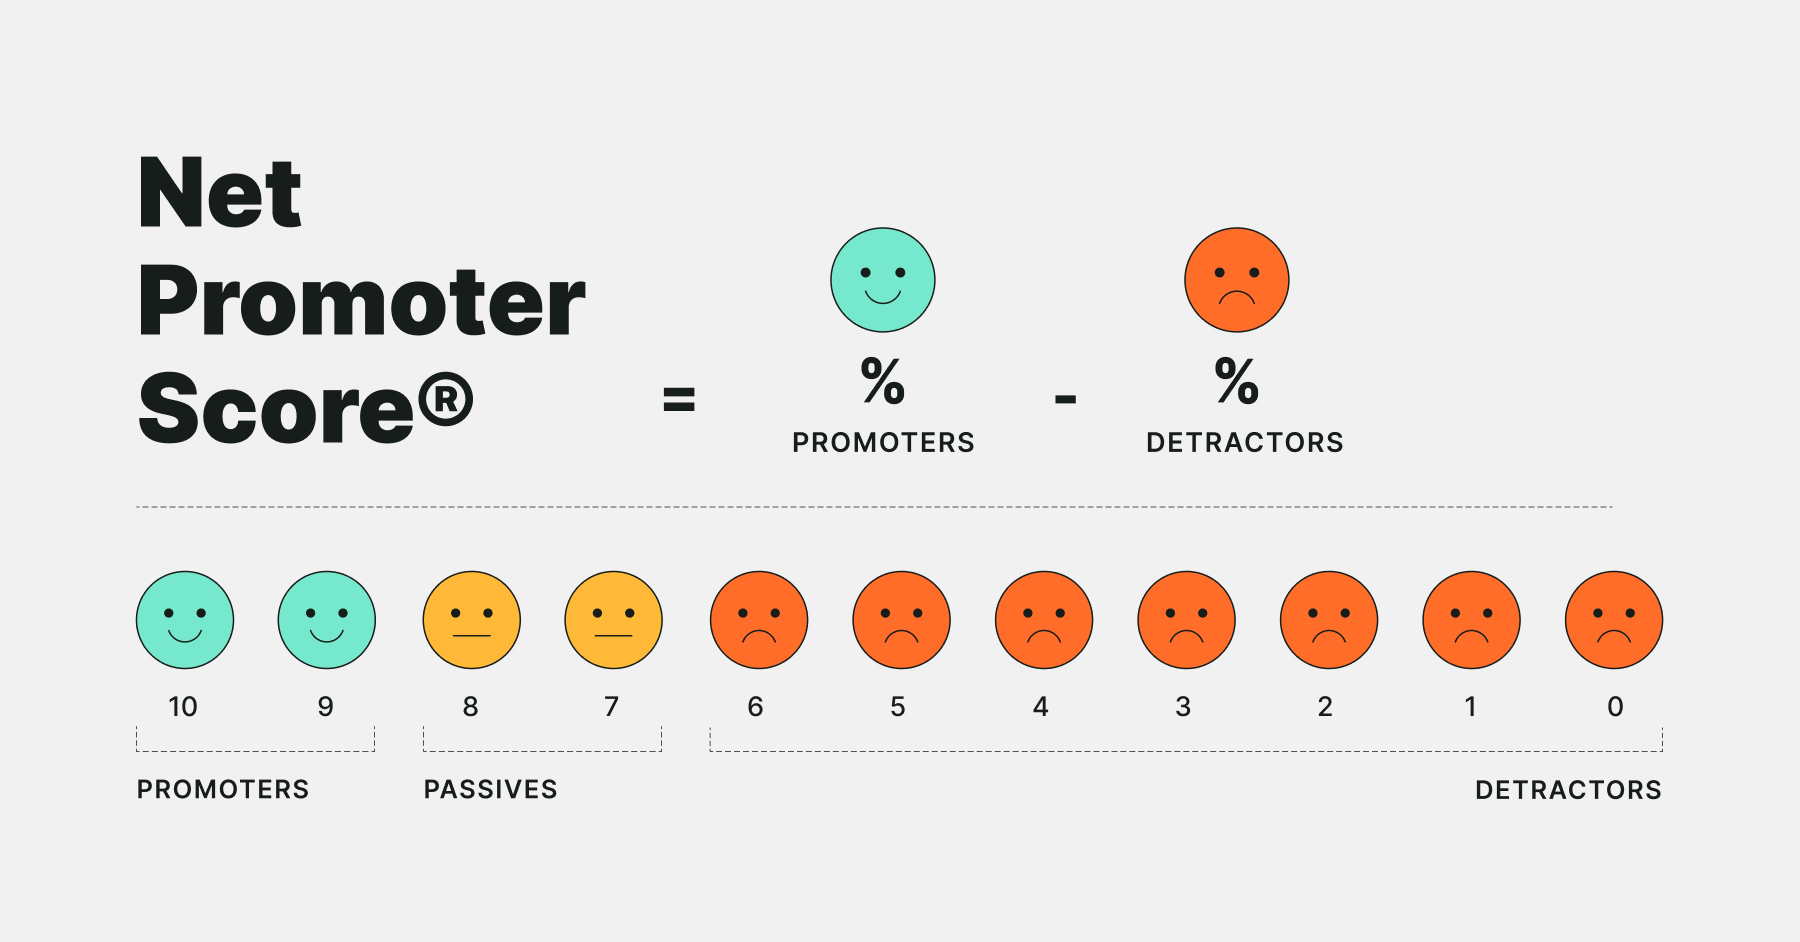
Net Promoter Score (NPS) asks customers one question: “How likely are you to recommend us to a friend or colleague?” Respondents answer on a 0–10 scale, and the formula groups them into three buckets: promoters (9–10), passives (7–8), and detractors (0–6). Your NPS equals the percentage of promoters minus the percentage of detractors.
The metric became popular because it’s simple to run and easy to benchmark against competitors. That simplicity, though, comes with tradeoffs worth understanding before you decide what to measure.
Why NPS falls short as a customer loyalty metric
The best NPS alternative depends on exactly what you want to measure. NPS captures intent to recommend, but intent and action are two different things. A customer might say they’d recommend you on a survey, then never actually tell anyone. Meanwhile, another customer might refer three friends without ever filling out a form.
NPS also lacks diagnostic power. When your score drops from 45 to 32, you know something changed, but you don’t know what. Was it pricing? Product quality? A bad support experience? The single number doesn’t say.
A few other limitations come up frequently:
- Oversimplification: Compressing a complex customer relationship into one number loses important nuance
- Response bias: Scores shift based on when you send the survey, how you phrase the question, and cultural differences in how people use rating scales
- No behavioral connection: A high NPS doesn’t guarantee customers will actually stay, buy again, or refer others
NPS still works as a general sentiment check—Airbnb used NPS to predict referrals across 600,000 users, proving it can surface likely advocates. But for teams looking to understand and improve loyalty, pairing it with behavioral metrics often delivers clearer, more actionable insights—McKinsey found CX leaders achieved more than double the revenue growth of CX laggards.
10 NPS alternatives that measure real customer loyalty
The metrics below move beyond stated intent to capture actual behavior, satisfaction at specific touchpoints, and long-term value. The right mix depends on your business model and what outcomes matter most to your team.
1. Customer Lifetime Value (CLV)
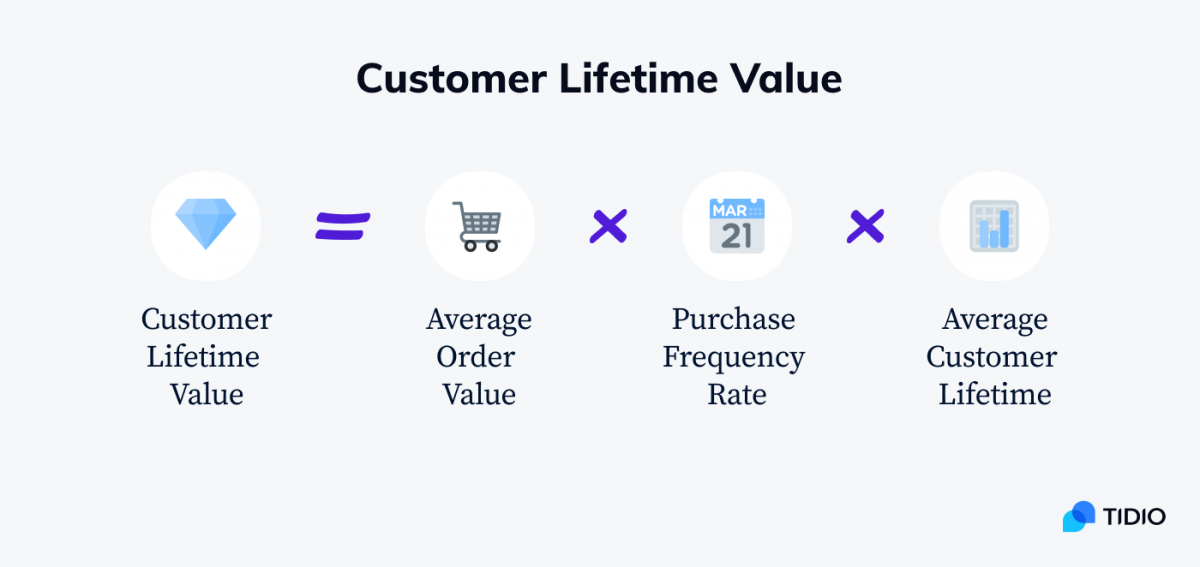
Customer Lifetime Value represents the total revenue you can expect from a single customer over the entire relationship. Unlike survey-based metrics, CLV measures financial loyalty through actual purchasing behavior.
The basic calculation multiplies average purchase value by purchase frequency and average customer lifespan. Knowing how to increase customer lifetime value starts with evaluating whether acquisition costs make sense. If you’re spending $200 to acquire customers worth $150, CLV reveals that gap clearly.
This metric works particularly well for long-term financial forecasting and comparing customer quality across acquisition channels. Referred customers often deliver higher CLV than customers from paid advertising, which makes CLV valuable for evaluating referral program performance.
2. Customer Retention Rate
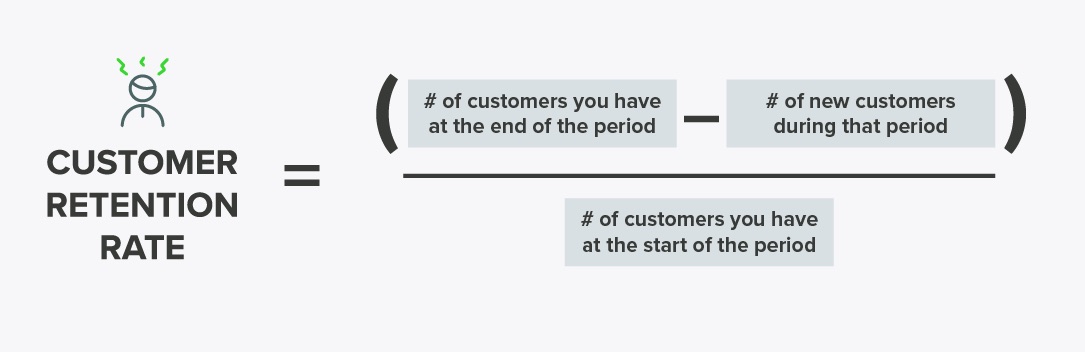
Retention rate measures the percentage of customers who continue doing business with you over a defined period. It tracks actual staying behavior rather than stated satisfaction.
For subscription businesses especially, retention rate often matters more than acquisition metrics—Bain & Company research shows a 5% retention increase can boost profits 25–95%. The metric also serves as an early warning system, since declining retention signals problems before they show up in revenue numbers—making it a critical input for retention marketing strategy.
3. Repeat Purchase Rate
Repeat purchase rate calculates the percentage of customers who make more than one purchase. For retail and ecommerce brands, this metric reveals whether customers find enough value to come back.
A high repeat purchase rate suggests strong product-market fit. Low rates might point to issues with product quality, pricing, or post-purchase experience. Either way, you’re measuring what customers actually do rather than what they say they might do.
4. Referral Rate and Advocacy Activity
Referral rate measures the percentage of customers who actively refer others to your business. This metric directly addresses NPS’s biggest limitation: it tracks actual advocacy behavior rather than stated intent to recommend.
When a customer shares a referral link and someone converts, you have concrete evidence of loyalty in action. Platforms like Extole help brands track referral rate through structured referral programs that capture every share, click, and conversion. The data reveals not just who your advocates are, but how effective their advocacy is at driving new business.
5. Customer Health Score
Customer Health Score is a composite metric that aggregates multiple signals into a single indicator of account vitality. Common inputs include usage frequency, support ticket volume, renewal history, and billing patterns.
The score is predictive rather than reactive. By combining behavioral signals, customer success teams can identify at-risk accounts before they churn. A customer with declining usage and increasing support tickets might still report high satisfaction on surveys, but their health score tells a different story. This metric works particularly well for B2B and subscription businesses.
6. Customer Satisfaction Score (CSAT)
CSAT measures satisfaction with a specific interaction, product, or experience. The typical question asks “How satisfied were you with your [experience/service/product]?” using a 1–5 or 1–7 scale.
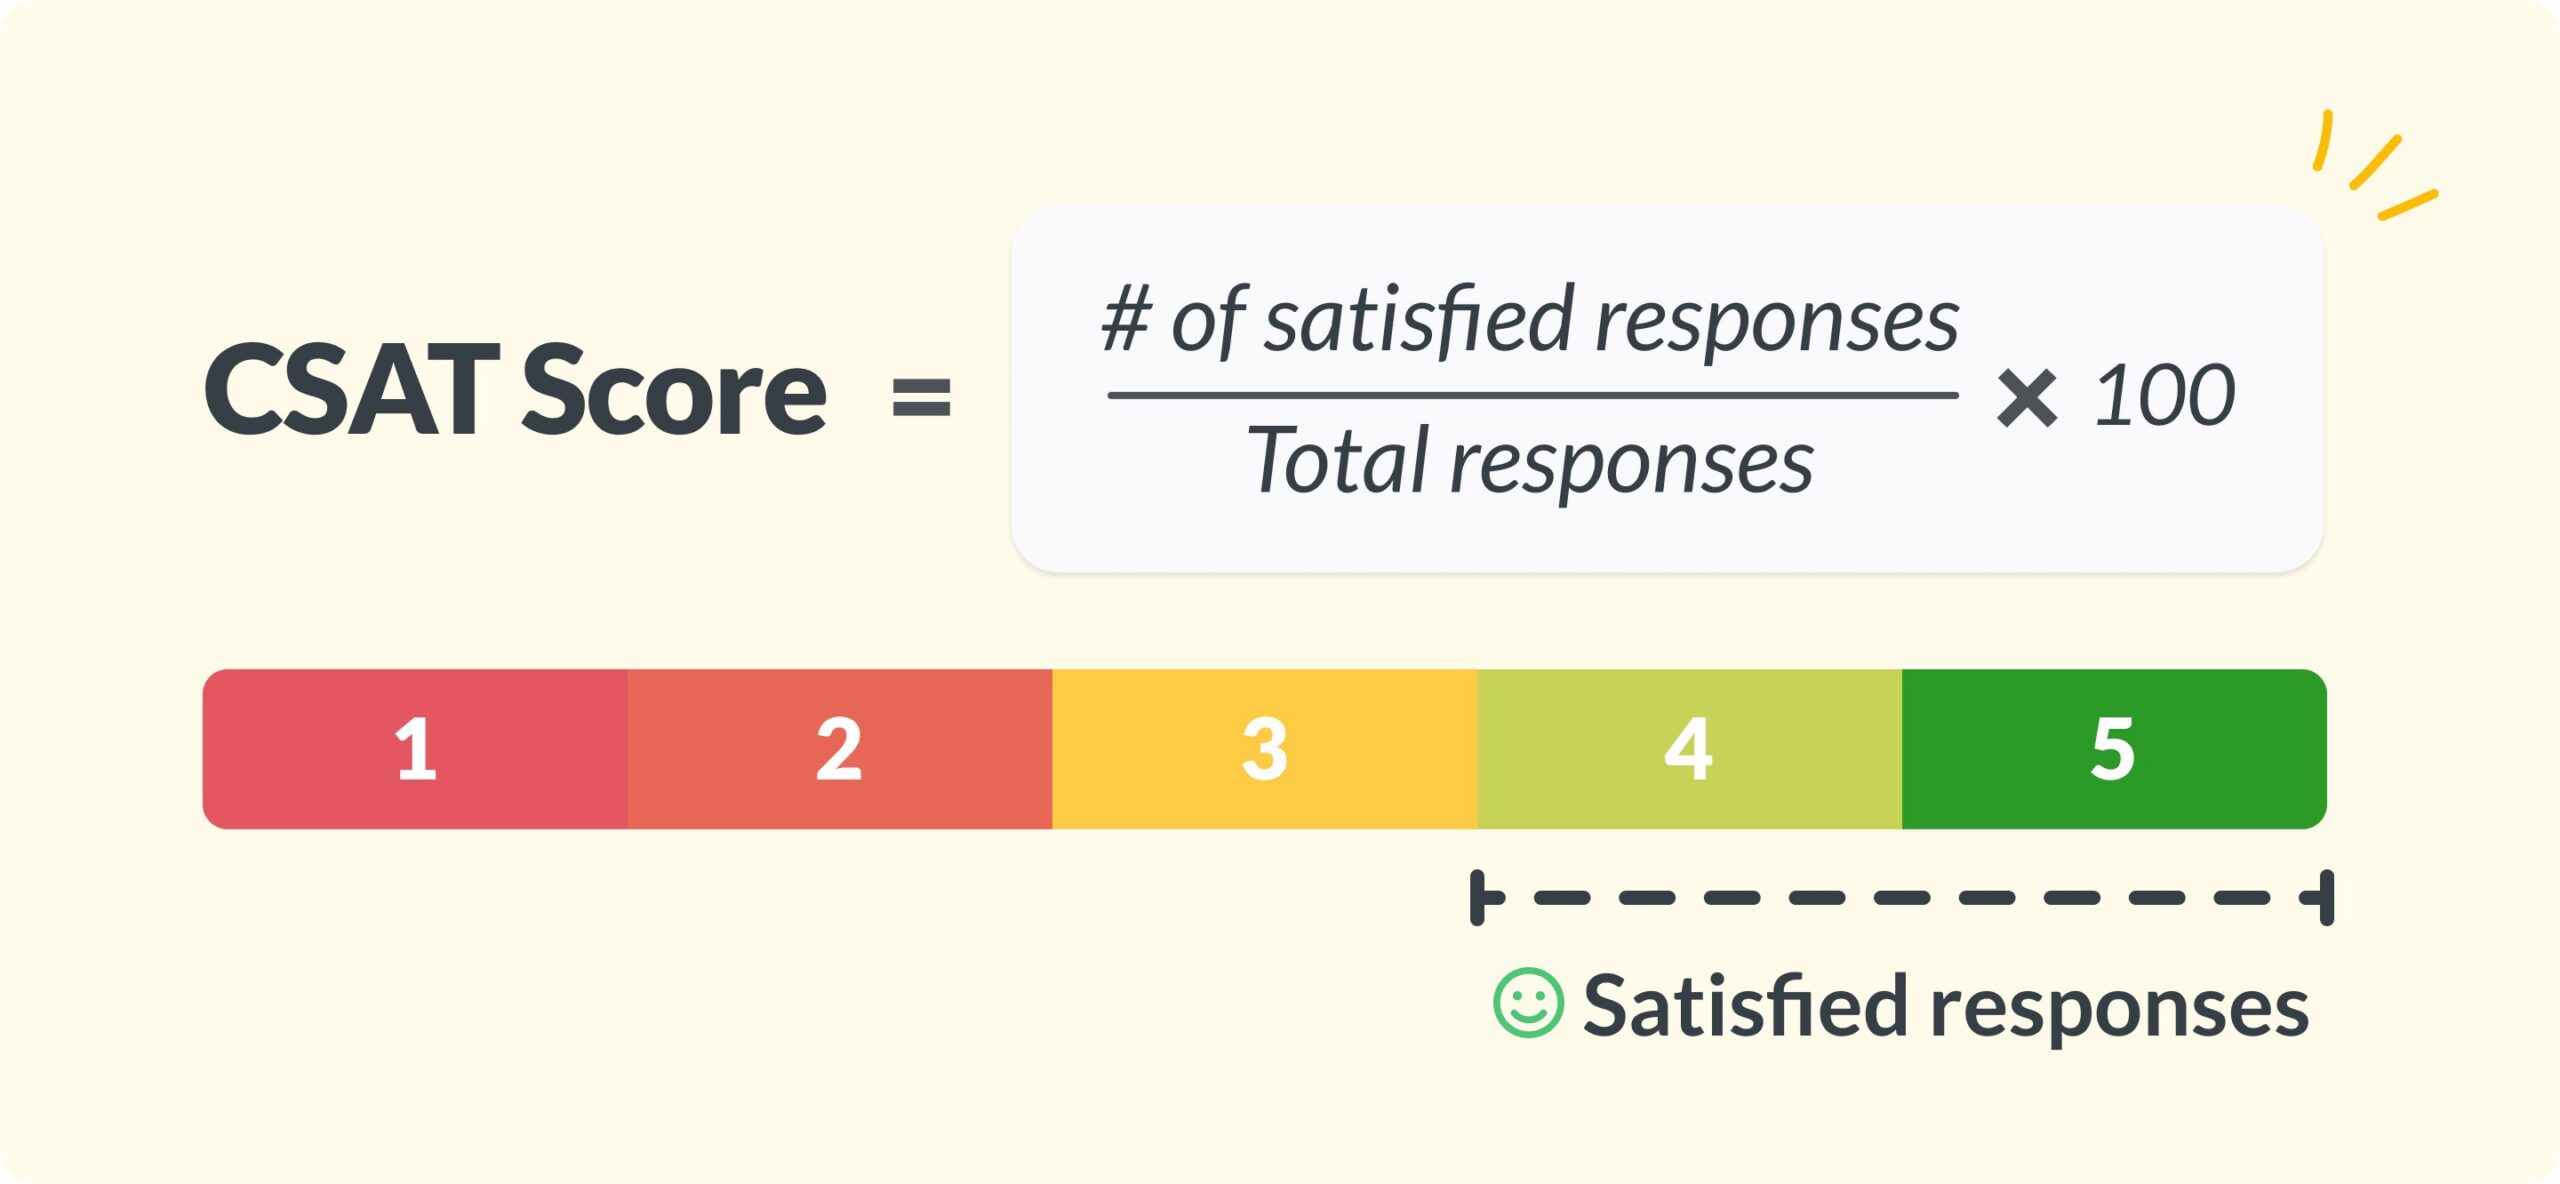
Unlike NPS, which captures general brand sentiment, CSAT pinpoints satisfaction at individual touchpoints. After a support call, checkout experience, or product delivery, CSAT reveals whether that specific interaction met expectations. This granularity makes it easier to identify and fix operational issues.
7. Customer Effort Score (CES)
Customer Effort Score measures how easy it was for customers to complete a task or resolve an issue. The standard question asks customers to rate their agreement with: “The company made it easy for me to handle my issue.”
Research from Gartner shows that reducing customer effort is more effective at building loyalty than delighting customers. High-effort experiences like long hold times, confusing processes, or multiple contacts to resolve issues tend to drive churn even when customers are otherwise satisfied.
8. Value Enhancement Score (VES)
Value Enhancement Score measures whether customers perceive they’re getting increasing value over time. It’s a newer metric designed to capture the trajectory of the customer relationship rather than a single snapshot.
VES works particularly well for SaaS and subscription businesses focused on expansion revenue. A customer who feels they’re getting more value each month is more likely to upgrade, renew, and advocate. The metric helps identify upsell opportunities while also flagging accounts where perceived value is declining.
9. Voice of Customer Programs
Voice of Customer (VoC) programs take a systematic approach to collecting and analyzing qualitative feedback across channels. Unlike single-question surveys, VoC captures direct, open-ended insights about customer pain points and needs.
Common VoC questions include “What could we do to improve your experience?” and “Is there anything we could do better?” The responses provide context that quantitative metrics miss. When your NPS drops, VoC data often explains why.
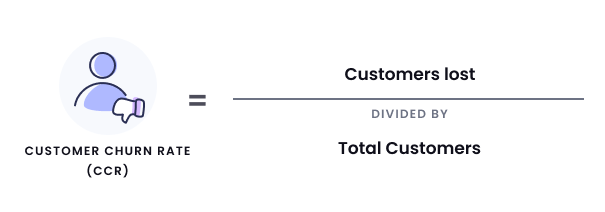
10. Customer Churn Rate
Churn rate measures the percentage of customers who stop doing business with you over a defined period. It’s a lagging indicator, meaning by the time someone churns, the relationship has already ended. Still, churn rate directly measures loyalty failure.
Tracking churn over time reveals whether retention efforts are working. Segmenting churn by customer cohort, acquisition channel, or product line can uncover patterns that inform strategy. For example, if customers acquired through paid ads churn at twice the rate of referred customers, that insight shapes budget allocation.
NPS vs modern loyalty metrics at a glance
| Metric | What It Measures | Type | Best Use Case |
|---|---|---|---|
| NPS | Intent to recommend | Survey | General loyalty pulse |
| CLV | Revenue per customer | Behavioral | Financial forecasting |
| Retention Rate | Staying behavior | Behavioral | Subscription businesses |
| Repeat Purchase Rate | Buying frequency | Behavioral | Retail and ecommerce |
| Referral Rate | Actual advocacy | Behavioral | Referral programs |
| Customer Health Score | Account vitality | Composite | B2B churn prediction |
| CSAT | Interaction satisfaction | Survey | Post-touchpoint feedback |
| CES | Effort and friction | Survey | Friction reduction |
| VES | Perceived value growth | Survey | SaaS expansion |
| VoC Programs | Qualitative insights | Qualitative | Root cause diagnosis |
| Churn Rate | Customer loss | Behavioral | Retention benchmarking |
How to choose the right NPS alternatives for your business
Selecting the right metrics involves matching measurement approaches to your specific goals and customer journey.
Step 1. Define the loyalty outcome you want to measure
Different metrics answer different questions. If you want to understand financial value, CLV is your metric. If you want to reduce friction, CES provides actionable data. If you want to measure actual advocacy, referral rate captures behavior that NPS only hints at.
Start by clarifying what “loyalty” means for your business. Is it repeat purchases? Renewals? Referrals? Revenue? The answer shapes which metrics matter most.
Step 2. Map metrics to the customer journey
Different metrics fit different journey stages:
- Post-interaction: CSAT and CES capture satisfaction with specific touchpoints
- Ongoing relationship: Retention rate and health scores track relationship strength over time
- Long-term value: CLV measures cumulative financial impact
- Advocacy: Referral rate captures customers who actively promote your brand
Step 3. Combine behavioral and attitudinal signals
Survey-based metrics like CSAT and CES reveal how customers feel. Behavioral metrics like retention rate, CLV, and referral rate show what customers actually do. A customer-led growth approach combines both signals to form the most complete picture.
A customer might report high satisfaction but never return. Another might complain frequently but keep buying. Neither signal alone tells the full story.
Step 4. Operationalize measurement across your stack
Metrics only matter if they’re actionable. That means integrating measurement into your CRM, marketing automation, and analytics tools so insights reach the teams who can act on them.
Platforms like Extole provide built-in analytics for tracking referral and advocacy metrics, connecting program performance to broader customer data. When measurement is embedded in your operational systems, optimization becomes continuous rather than occasional.
Turn loyalty measurement into a growth engine with Extole
Measuring loyalty is valuable, but activating it is transformative. When you identify your most loyal customers and give them structured ways to advocate, measurement becomes a growth channel.
Extole’s referral and advocacy platform helps brands track real advocacy behavior, including referral rate, advocate activity, and conversion attribution, while turning loyal customers into a scalable acquisition source.
Book a demo to see how Extole helps enterprise brands turn customer loyalty into measurable growth.
Frequently asked questions about NPS alternatives
What should I use instead of NPS?
The best NPS alternative depends on what you want to measure. CSAT works well for interaction-level satisfaction, CES for identifying friction points, CLV for financial value, and referral rate for actual advocacy behavior. Most teams benefit from combining several metrics rather than relying on any single measure.
Is CSAT better than NPS for measuring customer satisfaction?
CSAT measures satisfaction with specific interactions, making it more actionable for operational improvements. NPS captures general brand sentiment. Neither is universally better since they answer different questions. CSAT tells you whether a support call went well, while NPS tells you how customers feel about your brand overall.
Why is NPS considered an outdated metric?
NPS is considered outdated because it measures intent rather than behavior, provides no diagnostic insight into why customers feel the way they do, and reduces complex loyalty to a single number. Gartner predicts that more than 75% of organizations will abandon NPS as a primary measure of customer service success by 2025.
What is the difference between transactional NPS and relational NPS?
Transactional NPS (tNPS) is sent after specific interactions like a purchase, support call, or delivery to measure satisfaction with that touchpoint. Relational NPS is sent periodically, regardless of recent interactions, to gauge overall brand sentiment. Transactional NPS provides more actionable feedback, while relational NPS tracks sentiment trends over time.
Can multiple customer loyalty metrics be used together?
Yes, and most sophisticated programs do exactly that. Combining survey-based metrics like CSAT and CES with behavioral metrics like retention rate, CLV, and referral rate provides a more complete view of customer loyalty than any single metric alone.